In the July-to-September quarter, U.S. GDP grew by 1.9%.
This was President Trump’s reaction on Twitter…
We’re not here to take shots at the president. But it’s our mission to show you what’s going on in markets and the economy… regardless of what the official version may be.
And as I (Chris) will show you in today’s dispatch, the economy is weaker than the president claims.
In fact, according to Bill Bonner’s Doom Index, we’re edging closer to a nasty crash.
Bill is one of the cofounders here at Legacy Research, along with legendary speculator Doug Casey.
And Bill developed the Doom Index as an “early warning system” for financial disaster.
It tracks 11 separate indicators. These gauge the health of the Main Street economy and the stock market. Then, Bill and his team assign “Doom Points” for each indicator.
These tell us when financial, economic, and market conditions are signaling a crash.
Bill and his team backtested the index going back to the 1990s… and every time it hit 8, a stock market crash followed soon after.
I talked to Bill’s head of research, Joe Withrow, about what it means for the Doom Index to hit a 9. Here’s what he told me…
The numbers are falling apart. We just updated the Doom Index and it bumped up to a 9. The Doom Index is telling us to prepare for a crash.
The last time we got a reading of 9 was the first quarter of 2008… and we know how that turned out. The S&P 500 was cut in half over the next four quarters.
We don’t know if the crash will be next week… next month… or next quarter. But a reading of 9 is extreme. It tells us the economy is on MUCH weaker footing than most folks understand.
One of the indicators the Doom Index tracks is the ISM manufacturing index.
Every month, the Institute for Supply Management surveys more than 300 manufacturing firms about their production levels.
A score above 50 shows that factory output is expanding. A score below 50 shows that it’s shrinking.

As you can see, the ISM index has dropped to 47.8. That’s its lowest level since the aftermath of the 2008 financial crisis.
This tells us how many raw materials and finished goods are moving across the country by rail.
Bill likes to track this indicator because it’s the kind of number that’s hard to fudge.
And it confirms that the slowdown in manufacturing is real.

In the recent quarter, railcar use shrank for the second consecutive quarter. It’s now down 14% since the third quarter of last year.
Think of bank lending as the essential “fuel” for the economy.
More borrowing means more spending. More spending means more income for businesses and their employees. This means more money in people’s pockets, which leads to more spending.
Without expanding credit, the economy can grow only so much. And when credit starts to shrink – like it is today – the economy won’t be far behind.
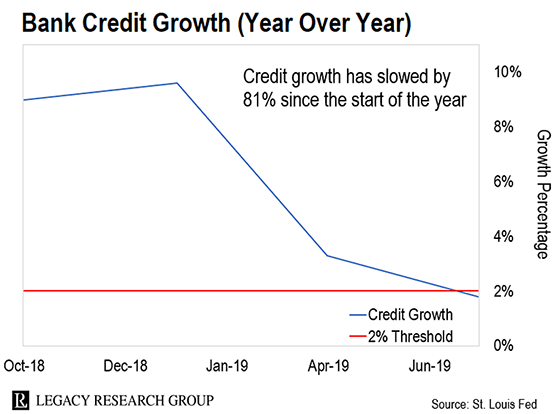
As you can see, credit growth has slowed by 81% since the start of the year. That’s like someone just slammed on the brakes for the economy.
Bill follows Richard Duncan. He’s an economist and financial author who heads up the Macro Watch advisory. And he’s an expert on the effect of credit on the economy.
And Duncan’s analysis shows that if credit growth falls below 2%, a recession is never far behind.
Bill’s research team has borne this out in backtesting of the Doom Index.
We don’t know for sure if doom is nigh. What we do know is that when these indicators have lined up in the past… trouble wasn’t far behind.
So now is a great time to play defense as well as offense in your portfolio.
Stock prices depend on earnings. And expanding earnings depend on an expanding economy. That’s why most stocks are a lousy place to be in a recession.
Gold, by contrast, doesn’t rely on earnings… or an expanding economy. Instead, it’s widely seen as a safe store of wealth. So it tends to rise in price as the economy… and the stock market… fall off a cliff.
Long-term investors get hit hard in a crash. But short-term traders are more nimble.
This allows traders to profit in any market – up or down.
It’s one of the reasons I’m so excited about colleague Teeka Tiwari’s new trading system.
It has been credited with accurately calling most major moves in the Dow over the past two decades – including the end of the dot-com crash and the 2008 financial crisis…
And backtesting shows the startling level of accuracy with which it has forecast events even under the most extreme conditions, including the Great Depression and Black Monday in October 1987.
On November 13, Teeka will announce the details of this system for the first time to readers.
He’s going to use it on camera to reveal what it sees ahead for the U.S. stock market, gold, the U.S. dollar, and interest rates.
I’ll have more for you on Teeka’s new system over the coming days. But if you want to secure your spot now, you can do so here.
Regards,
 |
Chris Lowe
November 4, 2019
Mahón, Menorca
Like what you’re reading? Send your thoughts to [email protected].