I (Chris Lowe) hope you got a chance to unplug and take a break from the markets over the holidays.
I spent time with family and friends in Dublin, Ireland, where I’m from. And I made the most of my time away from the computer screen.
But now, I’m back on my mission to bring you the best ideas about how to move the needle on your wealth from Teeka Tiwari, Jeff Brown, Dave Forest, and the rest of the Legacy Research team.
Later this week, I’ll introduce you to our newest hire – Nomi Prins.
She was a managing director at Goldman Sachs… a senior managing director at Bear Stearns in London… and a strategist at Lehman Brothers.
But she quit Wall Street in disgust over unethical practices there.
And she’s come on board to shed light on the ways financial systems are manipulated to serve the interests of an elite few at the expense of everyone else.
But to kick off the new year, I want to take a 30,000-foot view of the economy and the markets.
At Legacy, we believe that if you get the big picture right… everything else will follow. But with so much going on, it’s easy to get distracted from what really matters. So I’ve summed it up for you in six key charts.
I’ve written to you about this a lot. But inflation is probably the biggest threat to your wealth right now.
It’s measured by the Consumer Price Index (CPI).
In short, the higher the CPI goes, the less each dollar you earn or have saved buys you.

As you can see, right now, the annual inflation rate is running at 6.8%.
You’d have to go back to 1982, when President Reagan was in the White House, to find as steep a rise in the cost of living.
If inflation keeps climbing, it’ll be even more important than it was last year to get out of cash and into inflation-beating assets.
The S&P 500 returned 26.9% last year.
And over the last three years, it’s up more than 100%. That’s its highest three-year return since 1997–1999.
That’s great news if you’ve been invested in stocks. But it’s left valuations at record highs.
There are many ways to look at this. But the hardest to fudge with creative accounting is the price-to-sales (P/S) ratio.
It tells you how many dollars investors are paying for each dollar of a company’s sales.
Take a look at the P/S ratio of the S&P 500 – our regular stand-in for the U.S. stock market.

Investors are paying, on average, $3.26 for each dollar of sales the 500 companies listed on the index earned over the past year.
That’s up from $2.76 at the start of 2021. And it’s more than double what folks were paying before the 2008 crash.
This doesn’t mean another crash is around the corner. But it does mean this market is richly valued. Bargains are hard to find.
As regular readers will know, commodities are “hard assets.” They’re hard to produce more of relative to their existing supplies.
This makes them safe havens from devaluing fiat currencies in times of inflation.
And right now, commodities are an interesting value play.
The next chart looks at the S&P GSCI – which tracks the commodities market – relative to the S&P 500.
When the line on the chart is falling, commodities are getting cheaper relative to stocks. A rising line means commodities are getting more expensive relative to stocks.

As you can see, commodities have never been as cheap as they are right now relative to stocks.
If you’re looking for cheap inflation hedges in 2022, the commodities market is a great place to shop.
Like it or not, today’s economy can’t function without oil.
On a global basis, we burn 97 million barrels of the stuff a day.
And last year, the benchmark for U.S. prices – West Texas Intermediate (WTI) crude oil – rose 56%.
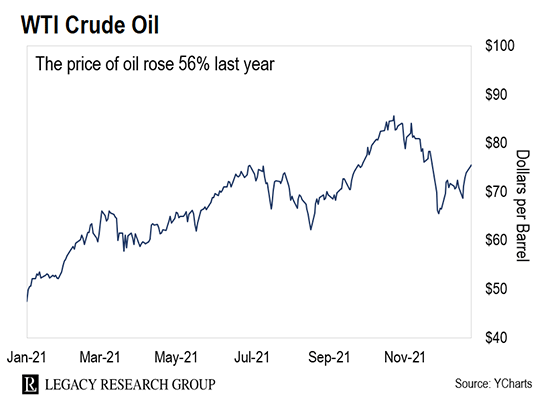
With the transition from fossil fuels to clean energy sources such as solar and wind, that’s counterintuitive.
But as our commodities expert, Dave Forest, has been showing his readers, this transition is bullish for oil prices over the short to medium term. Dave…
Last month, traders placed bets on $300 crude oil. That’s never happened before… not even when oil spiked to $140 a barrel in 2008.
They’re keying off government policy. President Biden has made several moves to limit or even ban oil drilling across the U.S. And activists have successfully forced oil majors such as Chevron (CVX) and Shell (RDS.A) to curb production.
That’s negative for anyone trying to drill new fields. But big investors see it as a positive for companies with existing production. The lack of drilling could trigger a supply shortage. That could send oil prices soaring.
As Teeka Tiwari readers know, adoption is one of the main drivers of bitcoin (BTC) prices.
Teeka first recommended the cryptocurrency to his readers in April 2016, when it was trading for just $428.
It’s up 12,231% since then. And since the start, Teeka has been hammering on why crypto adoption is so important.
That’s why the next chart will be key this year. It shows the number of active bitcoin wallet addresses.

|
Source: Raoul Pal
The number of active wallets peaked early last year. But if Teeka is right, we’ll see adoption – and prices – power higher from here.
As he wrote about here, he says bitcoin is on track to hit $500,000 as it goes mainstream.
We’re also bullish on bleeding-edge tech stocks here at Legacy.
That’s why we have Silicon Valley insider and early-stage tech investor Jeff Brown on the team.
It’s also why our last chart today is of the returns of the tech-heavy Nasdaq 100 Index.
It ended 2008 down by 42%. But since then, it’s had a 13-year streak of positive returns, with a 27% gain in 2021.
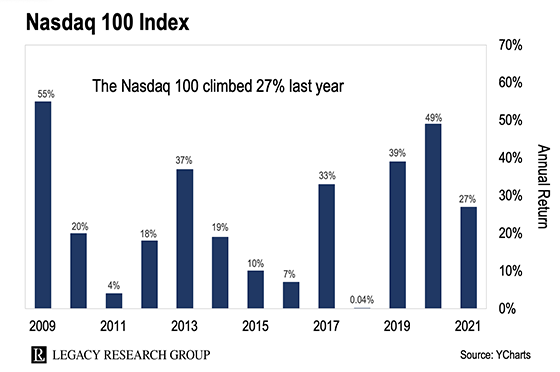
If Jeff is right, the best is yet to come. As he’s been showing his readers, the rollout of 5G wireless – along with leaps in artificial intelligence (AI)… self-driving cars… gene editing… and quantum computing – means that streak is set to continue.
And he says even bigger returns are on offer in what he calls “Day One” investments.
These are private tech companies regular folks can invest in through something called crowdfunding deals. You can read more on these from Jeff here.
Until tomorrow…
 |
Chris Lowe
January 3, 2022
Dublin, Ireland