By now, I (Chris Lowe) don’t need to remind you of all the red ink.
If you have money in the markets, you’re feeling the pain in your portfolio.
But last week, there was a glimpse of light at the end of the tunnel.
The S&P 500 and the Dow notched their biggest gains since November 2020.
This snapped a two-month losing streak.
Meanwhile, the tech-heavy Nasdaq jumped 6.8%. That was its first weekly gain since the end of March.
And that wasn’t even the most bullish news we got ahead of Memorial Day weekend.
That’s going by the Personal Consumption Expenditures (PCE) price index.
It’s not as prevalent as the Consumer Price Index (CPI), which is the way most folks measure inflation.
But it covers a broader range of spending than the CPI. And it’s the Fed’s main inflation gauge. So the PCE index is just as important as the CPI… if not more so.
On Friday, we learned that the PCE index was up 6.3% in April compared to a year before.
That’s still high. But it’s lower than the March reading of 6.6%.
And it’s significant. This is the first time the PCE index has fallen since November 2020.

Continually slowing inflation would signal the end of the heavy selling pressure we’ve seen all year in stocks.
When it gets too high, the Fed jacks up interest rates, as it’s done twice this year.
This pushes up bond yields… which pushes down stock market valuations.
It’s due to something called the discounted cash flow (DCF) model.
It’s a tricky concept. But it’s important to have a basic idea of how it works because it greatly affects stock prices.
Without getting too deep in the weeds, Wall Street analysts use this model to figure out the present value of a company’s expected future cash flows.
DCF is based on the fact that a dollar today is worth more than a dollar down the road. You can take a dollar today and earn interest on it over time in a relatively safe investment such as a bond.
So the model uses something called the discount rate. It’s the yield you could earn on the 10-year Treasury note if you don’t tie up your money in stocks.
As the 10-year yield rises… and the income available to you as a bondholder does too… a stock’s expected future cash flows become relatively less attractive.
Just know that hedge funds, pensions, and other large institutional investors rely heavily on this model to value stocks.
And it’s these deep-pocketed investors that really move the market.
We’ve seen that play out this year. As rising inflation has pushed up interest rates and bond yields, stocks have sunk.

Crucially, the inverse is also true. Slowing inflation is good for stocks.
It puts the Fed under less pressure to raise interest rates. This means a lower discount rate… and higher stock valuations as a result.
Inflation is a function of supply and demand. If supply increases… or demand drops… inflation will cool down.
And recently, we saw promising signs on both fronts.
First, supply chain disruptions are improving.
That’s going by the New York Fed’s Global Supply Chain Pressure Index.
It tracks global transportation costs as well as delivery times and backlogs.

We’re not out of the woods yet. We saw an uptick as China kicked off another string of COVID-19-related lockdowns.
But between January and February, we saw the steepest fall in this index since late 2020. That means supply chain pressure is easing. And that’s encouraging.
Meantime, money supply is shrinking. That’ll reduce spending – aka demand.
The most common measure of the number of dollars in circulation in the U.S. economy is called M2 money supply.
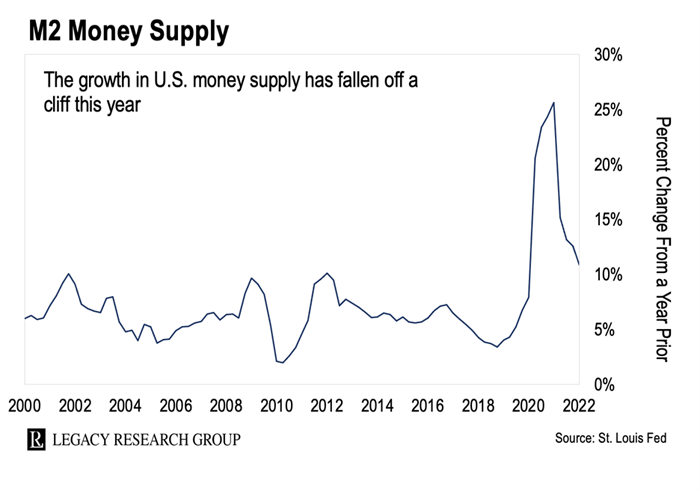
When the blue line on the chart above is going up, money supply growth is accelerating. When the line goes down, it means money supply growth is slowing.
As you can see, M2 growth took off in 2020, when the pandemic hit and Washington unleashed a wave of stimulus.
But since the beginning of 2021, M2 has fallen. That’s left it more in line with its normal historical range.
That points to lower inflation ahead.
And because of how DCF works, that’s a strong tailwind for stocks.
So now isn’t the time to throw in the towel on stocks…
I know it’s been a painful year. My personal portfolio has also suffered.
But instead of panicking along with the crowd, smart investors buy quality stocks at a bargain – so they’ll profit more as these stocks climb.
That’s what company insiders are doing.
Figures from VerityData reveal that, last month, corporate executives bought stock in their own companies more than they have since March 2020 at the bottom of the pandemic induced sell-off.
Jeff Brown just revealed five of his top “buy now” stocks.
He’s a Silicon Valley insider and our tech expert here at Legacy Research.
And on Friday at his tech investing e-letter, The Bleeding Edge, he shared the names and ticker symbols of the top five large-cap tech stocks on his buy list.
These are all open recommendations in his Near Future Report advisory. That’s where he focuses on blue-chip tech stocks that are appropriate for more conservative investors.
He’s sharing them because he believes they’re great long-term investments. And the recent selling has left them at steep discounts. Jeff…
These kinds of pullbacks can be an excellent opportunity to buy over-punished stocks. Fears about interest rates and inflation have dragged down the markets… and many stocks have sunk to irrationally low levels.
All five of Jeff’s recommendations are great choices for allocating your capital.
You can find the list in the Friday mailbag edition of his Bleeding Edge e-letter here.
Regards,
 |
Chris Lowe
June 1, 2022